10 Best Data Science Courses to Take in 2023
Looking for the best courses to learn Data Science? This ranking has got you covered!
In this guide, I’ve gathered the best courses on Data Science and ranked them according to a well-established methodology which you can read about down below.
But if you’re in a rush, here are my top picks. Click on one to skip to the course details:
| Course | Workload | In Brief |
| 1. Introduction to Computational Thinking and Data Science (MIT) | 100—140 hours | Super comprehensive and rigorous Python course on data science fundamentals |
| 2. Foundations: Data, Data, Everywhere (Google) | 20 hours | Prepares you for a career in data analytics |
| 3. Data Science: R Basics (Harvard) | 16 hours | Builds a strong foundation in R to tackle in-depth courses |
| 4. Python for Data Science (freeCodeCamp) | 12 hours | Great if you don’t know Python but want to do data science — with free certificate |
| 5. Data Science for Everyone (DataCamp) | 4 hours | Excellent introduction to data science and its applications with no coding involved |
| 6. A Crash Course in Data Science (Johns Hopkins) | 8 hours | For non-technical business people managing or working with data scientists |
| 7. Process Mining: Data science in Action (Eindhoven Tech) | 22 hours | Teaches a form of applied data science called process mining |
| 8. Data Science Math Skills (Duke) | 13 hours | Overview of core mathematical ideas for data science |
| 9. Python for Machine Learning & Data Science (Udemy) | 44 hours | Excellent course on data science and machine learning for those already confident in Python |
| 10. Data Science with R (Pluralsight) | 3 hours | Good introductory course to R |
What is Data Science?
Data science, like any other science, deals with scientific induction. Scientific induction is the reasoning which forms general principles from specific observations.
Let’s take Newton’s second law which describes motion of bodies as an example: Force = Mass × Acceleration. Did one of the greatest physicists ever come up with this formula by experimenting with every possible acceleration, mass, and force?
No. Instead, he saw a trend, a pattern in the way the objects moved, tested and measured the relationship between the variables, and then brilliantly formulated an equation that closely modeled this relationship. In other words, induction moves from the specific to the general, or from the known to the unknown.
What does induction have to do with data science? Data scientists take this principle to the extreme. Data science seeks to utilize what data we have to answer a question, and uses the known to predict the unknown.
Data science has been made possible thanks to the technological revolution. We are now living in a digital age where data is everywhere. In fact, about 2.5 quintillion bytes of data (that’s 18 zeros!) are produced daily. Data galore!
But with such a vast amount of data, it would be impossible for humans to sift through them all (no one wants to go through tens of thousands of rows of Excel spreadsheets), yet alone discover trends.
So instead, data scientists offload this difficult computational work of extracting patterns to machines. Hence the term machine learning, or deep learning. But sometimes the machine spits out nonsense, or maybe the data given to the machine is garbage.
Hence, data scientists are needed to ensure that data fed to the machine is neat and tidy, that the right kind of machine is chosen and can make sense of the data, and that the results the machine gave us makes sense. Oh, and we also have to communicate and present the findings to those less “machine-inclined”. All in a day’s work as a data scientist!
Not only can data science be an extremely interesting and useful field, but it is also booming in popularity according to LinkedIn, being hailed as the sexiest job of the 21st century by Harvard. Data scientists are paid well too: the estimated total median pay for a Data Scientist is $120k per year in the United States, according to glassdoor.
One note about this ranking. Although data science is typically considered a superset of data analytics, data analytics has been getting a lot of traction in its own right, so I’ve also included picks that explicitly focus on data analytics in this ranking. We’ve also made sure to include Python and R as they are the most popular programming languages used for data science.

Course Ranking Methodology
I built this ranking following the now tried-and-tested methodology used in previous rankings. It involves a three-step process:
First, I’m a content writer for Class Central, the leading search engine for online courses.
I (@elham) built this ranking in collaboration with my friend and colleague @manoel.
We started building this ranking by looking at courses from our database of 100K online courses. We looked at things like ratings, reviews, and bookmarks to make a preliminary selection. This phase was a purely data-driven phase.
It rapidly helped surface some of the best courses out there. Good courses get noticed by word of mouth — and the very best tend to gather a lot of attention. That said, reviews don’t always tell the whole story.
In fact, some courses are so good at hugging the spotlight that other excellent resources can go unnoticed. So the next step was to bring our own knowledge of online education into the mix.
Second, we used our experience as online learners to evaluate each preliminary pick.
We both come from computer science backgrounds and are prolific online learners, having completed about 45 MOOCs between us. Additionally, Manoel has an online bachelor’s in computer science, while I am currently completing my foundation in computer science. In fact, data science is the primary reason I’m interested in CS!
After gathering the courses, we analyzed and sifted through them, ranking them one by one. We bounced ideas off each other and made iterative improvements to the rankings, until we were both satisfied with the end result: the ranking you’re reading right now.
Third, during our research, we came across courses that felt well-made but weren’t well-known. If we adopted a purely data-centric approach, we would have to leave those courses out of the ranking, if only because they had fewer enrollments.
Instead, we favored a holistic approach. To add some flavor to this ranking, we’ve included a diverse set of data science courses that hopefully meet different learner preferences.
After going through this process — combining Class Central data, our experience as lifelong learners, and a lot of editing — we arrived at our final ranking. So far, we’ve spent more than 15 hours building this ranking, and we intend to continue updating it in the future.
Course Ranking Statistics
Here are some aggregate stats about the ranking:
- The number of enrollments for each course combines to a total of 2.3 million enrollments, with the highest enrolled course having 714k enrollments.
- Seven of the courses are free or free-to-audit, while three courses are paid.
- Seven courses are beginner level, with the rest at an intermediate level.
- This course has a diverse list of 6 providers, with the most-represented provider being Coursera.
- Three of the courses in this ranking use Python, two use R, and the rest do not involve coding.
- Around 340k people are following Data Science Courses on Class Central.
Without further ado, let’s get to the top picks.
1. Introduction to Computational Thinking and Data Science (Massachusetts Institute of Technology)

My number #1 pick for the best data science course would have to be Introduction to Computational Thinking and Data Science, offered by the Massachusetts Institute of Technology on edX.
The reason why this course is the first on this ranking is because it is designed to teach you with a wide variety of concepts and methods to excel in computational thinking and data science, and does so very rigorously, as you’d expect from an MIT course. And when I say “wide variety”, I mean it: this course has by far the highest workload in the ranking!
This course is meant to be the continuation of Introduction to Computer Science and Programming Using Python, although if you have prior Python programming experience and some knowledge of algorithms and complexity, you should be ready to take this course. Else, maybe check out one of the courses in my Python ranking.
A word of caution, since this course is a one-to-one reflection of what students at MIT learn and do on campus, you may find some of the course material and assignments challenging. Remember, challenge brings effort, and effort brings success!
What You’ll Learn
The major topics discussed in this course are optimization problems, stochastic thinking, modeling aspects of the world, and advanced features and libraries of Python.
The course starts with an introduction to optimization models. Many problems can be formulated in terms of a function, under a set of constraints, with a goal to fulfill. Oftentimes, you’ll come across problems in the real world where you want to minimize or maximize the results of these functions. For example, finding the shortest distance from one city to another. However, trying to find an optimal solution can get exponentially more difficult when trying to solve for multiple parameters. So how can we possibly solve them in a reasonable amount of time?
Introducing efficient algorithms. You’ll gain knowledge of the most common and useful algorithms and models used in computer science — to name a few: greedy algorithms, breadth-first search, and depth-first search. You’ll use these to tackle optimization problems, like the knapsack problem, curve fitting on graphs, and clustering.
Next, the course explores stochastic thinking — that is, thinking in terms of probabilities. Randomness is an incredibly powerful tool for building computations that model the world. You’ll use randomness to simulate solutions to problems, like what’s the probability that two people in a group share the same birthday, or even solve problems that do not involve randomness, like estimating the area under a curve.
To analyze the answers to the problems you’ve simulated, the course covers a couple of important statistical techniques. These include plotting probability density functions with PyLab and their types of distribution, confidence intervals, sampling and standard error, and much more.
The course also introduces machine learning. You’ll distinguish between supervised and unsupervised learning, and deep dive into the theory behind machine learning applications, like linear regression and clustering. While we’re on the subject, if you’re interested in machine learning, you may want to have a look at this ranking.
There are three kinds of lies: lies, damned lies, and statistics.
The final section of the course ends by discussing the limitations and pitfalls of statistics, and then explaining how to avoid some of the common statistical sins used to mislead people.
How You’ll Learn
The course is 9 weeks long, with an expected 14 to 16 hours of study time each week. You’ll learn through video lectures and you’ll spend time applying what you’ve been taught in the problem sets provided.
Regarding assessments, the problem sets and exams can be taken for free, although you’ll need to be a verified learner to earn a certificate.
| Institution | Massachusetts Institute of Technology |
| Provider | edX |
| Instructors | Eric Grimson, John Guttag, Ana Bell |
| Level | Intermediate |
| Workload | 100–140 hours total |
| Enrollments | 211K |
| Certificate | Paid |
Fun Facts
- This course has 8.3k bookmarks on Class Central.
- The course is based on the book Introduction to Computation and Programming Using Python, Second Edition.
- It’s the second and last course of the edX XSeries Program, Computational Thinking using Python.
- Prof. Eric Grimson, the lead course instructor, has a 79 h-index on Google Scholar — if you’re wondering, yes, that’s a lot!
If you’re interested in this course, you can find more information about the course and how to enroll here.
2. Foundations: Data, Data, Everywhere (Google)

My second pick for the best data science course is Foundations: Data, Data, Everywhere, offered by Google on Coursera. If you’re looking for a program that’ll prepare you for a data analytics career, this course might be what you need because it’s very hands-on and job-oriented.
Taught by Google’s own data analysts, this course provides you with the skills and mindset necessary to become a successful junior data analyst. You’ll understand what it means to be a data analyst and learn what tools and processes data analysts use in their day-to-day workflow.
You won’t need any prior experience in order to take this course.
What You’ll Learn
The course covers the roles and responsibilities of a junior data analyst, how businesses transform data into actionable insights, spreadsheet basics, database and query basics, and data visualization basics.
The course begins with an introduction to data and data analytics. Data is a collection of raw information, while data analysis is the process of piecing together data to draw conclusions, form predictions, and make decisions. You’ll learn the role data analysts play in informing smarter business decisions.
The next section hammers down five essential skills of data analysts, and five key aspects of analytical thinking. You’ll see how having these abilities turns you into a better data-driven decision-maker.
Afterwards, you’ll explore the six stages of the data life cycle, like capturing, analyzing, and destroying data. With this knowledge, you’ll understand how to approach the data analysis process, which consists of six phases. Yes, there are a lot of stages to take into account, but remember that following these phases ensures that you don’t accidentally overlook an important matter — say sanitizing or standardizing your data!
You’ll open up and peek into the data analyst’s toolbox. The course will discuss two ways we can store data: in spreadsheets like Microsoft Excel or Google Sheets; or in databases that we can interact with using query languages like SQL. You’ll understand when to use one over the other. Additionally, the course will cover how to visualize data patterns and trends with tools like Tableau, Looker, and R.
Lastly, you’ll look into the various kinds of job opportunities available for data analysts, the best practices in the job search, and what companies expect from your work. The course ends with a reminder of the importance of fairness and avoiding bias when analyzing data for business tasks.
How You’ll Learn
The course is 5 weeks long with an average workload of 4 hours per week. The primary medium of instruction is video lectures and reading materials, both of which are excellent in terms of production quality.
Regarding assessments, there’ll be 5 weekly challenges plus a final course challenge that you’ll have to complete to earn a grade if you’re paying for the certificate. Not only that, the course provides multiple short quizzes and flashcards that you can use to revise what you’ve learned.
| Institution | |
| Provider | Coursera |
| Level | Beginner |
| Workload | 20 hours total |
| Enrollments | 700K |
| Rating | 4.8 / 5.0 (33K) |
| Certificate | Paid |
Fun Facts
- This course is the first course of the Google Data Analytics Professional Certificate. It helps prepare you for applying to entry-level data analyst jobs.
- The professional certificate uses the R programming language. No Python here!
- As one of the largest companies in the world when it comes to data collection and storage, Google employs a huge number of data scientists, making them an excellent source for learning data science.
If you’re interested in this course, you can find more information about the course and how to enroll here.
3. Data Science: R Basics (Harvard University)
My third pick for the best data science course is Data Science: R Basics, offered by Harvard University on edX.
What sets this course apart from others is its unique pedagogy. Through a case study focusing on crime in the United States, you’ll analyze and use a dataset to answer questions like ‘What is the smallest state?’, ‘What is the most dangerous state?’, and ‘What is the average murder rate in the entirety of the US?’ — without googling of course!
Although no programming experience is required, the course assumes you are comfortable with basic math and algebra.
What You’ll Learn
The course is split into four sections: R Basics, Vectors and Sorting, Wrangling and Visualizing Data, and Programming Basics.
Beginning with the fundamentals of R and RStudio, you’ll understand what makes R a popular language for data analysis. You’ll study what objects are, how to define and perform basic arithmetic and logical operations with them. The course covers a couple of important pre-defined functions in R. You’ll also be able to distinguish between the various data types in R (3 and ‘3’ are two different things!).
Next, you’ll come across another important feature of R — vectors. Vectors are powerful as they form the building blocks of big datasets. You’ll create vectors and use them to build lists of cities or sequences of numbers which you can then sort or sum. The course guides you on the basics of vector arithmetics, like how to add two vectors together or what it means to scale a vector. Additionally, you’ll use indexing and subsetting methods to find the most dangerous state in America.
Lastly, you’ll be taught the basics of plotting in R, to help communicate your insights to a wider audience. You’ll learn four different kinds of plots you can use to visualize patterns and trends in the data: line plot, histogram, boxplot, and heatmap.
How You’ll Learn
This course is 8 weeks long, with each week taking 1 to 2 hours to complete. The course contains a series of many video lectures and reading materials.
Regarding assessments, some of the exercises in the course involve writing code and submitting it directly through DataCamp’s browser-based programming environment, although major assessments must be completed using RStudio.
| Institution | Harvard University |
| Provider | edX |
| Instructor | Rafael Irizarry |
| Level | Beginner |
| Workload | 16 hours total |
| Enrollments | 700K |
| Certificate | Paid |
Fun Facts
- Data Science: R Basics has 6.8k bookmarks on Class Central.
- It is the first course out of nine from Harvard’s intensive Data Science Professional Certificate.
- The Professional Certificates comes with a companion book written by Rafael Irizarry, the course instructor.
- We mentioned it earlier, but it bears repeating: you’ll complete some of the assignments via DataCamp’s convenient browser-based code editor. If you enjoy DataCamp, you may want to check our fifth pick below.
If you’re interested in this course, you can find more information about the course and how to enroll here.
4. Python for Data Science – Course for Beginners (Learn Python, Pandas, NumPy, Matplotlib)
If you want to learn data science with Python but have no programming experience, this course is for you.
This beginner-friendly course on freeCodeCamp’s YouTube channel will guide you from the ground up to help you acquire the fundamentals of both Python and data science. The course not only covers Python and data science from a conceptual standpoint, it also covers the tools and libraries data scientists use, like Anaconda, NumPy, Pandas, and Matplotlib, so you get plenty of practical experience as well.
What You’ll Learn
The course covers four main topics: Problem Solving, Python’s strength, Python fundamentals, and Data Science.
The course starts off with a tutorial on problem solving with programming, the most essential skill any programmer should have. You’ll learn how to approach complex problems and break them down into simpler parts, along with simple algorithms. You’ll then install and run Python with Anaconda, a popular distribution of Python used for data science.
Once you have set up your Jupyter Notebook coding environment, you’ll move on to the basics of Python programming. This includes learning about variables and operators, booleans and comparisons, control flow and functions, and much much more.
The course then instructs you on some more advanced Python topics, like importing and using Python modules, modifying and parsing text, as well as key data structures like lists, tuples, sets and dictionaries, and when to use one over the other.
All of these combined will make you an excellent Python programmer capable of writing small programs. But that is not all the course will teach you.
You’ll be introduced to three of the most popular Python libraries used in data science. Starting with NumPy, you’ll write fast and efficient code with NumPy arrays that are 5–100 times faster than regular Python lists.
Afterwards you’ll move on to NumPy’s big brother, Pandas. Pandas is used to represent and compute rows and columns of data (put differently tables) which you’ll be dealing with a lot of as a data scientist. Finally, you’ll learn about Matplotlib, a highly-configurable data visualization library that allows you to plot and reveal the patterns hiding within data.
How You’ll Learn
The course is 12 hours long and presented in a lecture-and-slide-s format, with frequent coding demonstrations. You are expected to code along with the instructor in order to apply and retain the concepts taught.
| Institution | freeCodeCamp |
| Provider | Youtube |
| Instructor | Maxwell Armi |
| Level | Beginner |
| Workload | 12 hours total |
| Views | 1.6M views |
| Rating | 45K likes |
| Certificate | None |
Fun Facts
- This course includes a free certificate.
- freeCodeCamp’s Youtube channel has over 1000 videos and lectures on various computer science and programming topics — all for free!
- The course instructor, Maxwell Armi, has his own YouTube channel filled with data science videos. Check him out!
If you’re interested in this course, you can find more information about the course and how to enroll here.
5. Data Science for Everyone (Datacamp)
Similar to Google’s Foundations: Data, Data, Everywhere but much shorter, DataCamp’s Data Science for Everyone teaches data science with no coding involved. If you’re not sure about what data science actually is and what its applications are, this course will enlighten you.
Data Science for Everyone introduces you to the world of data science, the different roles and responsibilities a data scientist may have, as well as the kind of work data scientists do as part of their career.
You do not need any prior experience in order to take this course.
What You’ll Learn
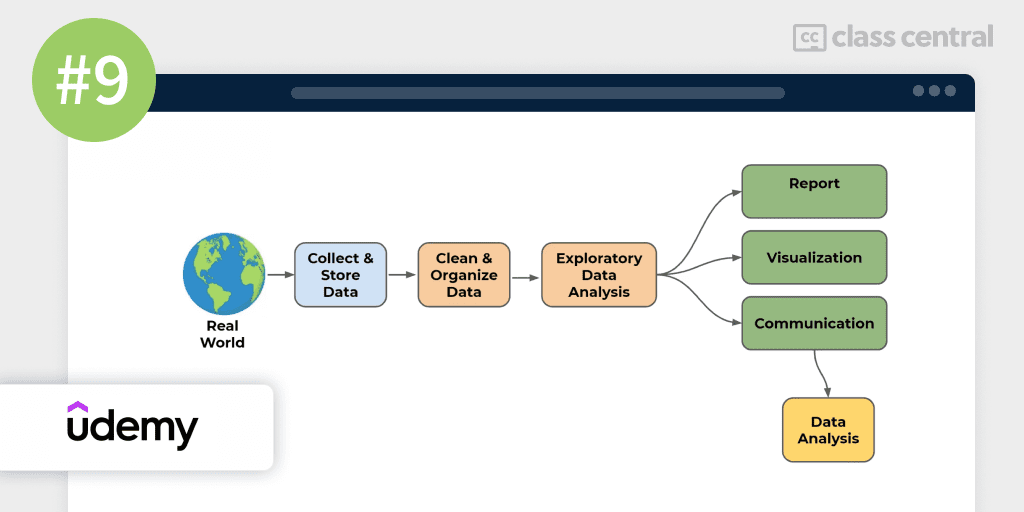
Data science simply defined is the set of methodologies for taking in data at scale and using them to draw meaningful conclusions. You’ll uncover the first four steps of the data science workflow: data collection & storage, data preparation, exploration & visualization, and experimentation & prediction. The course then describes the four common jobs of data science — data engineer, data analyst, data scientist, and machine learning scientist — and where they fit in the data science workflow.
The course unpacks the first step of the data science workflow: data collection & storage. You’ll learn where data scientists extract their data from, what data looks like and how to efficiently store them, and how a data pipeline can automate the process.
Next, you’ll learn about step two and three of the workflow: data preparation, exploration and visualization. Data preparation is the most important part of the data science workflow. Data scientists spend 80% of their time sanitizing their data because of Garbage In, Garbage Out principle — if you give a model garbage, then the predictions you get will be garbage. You’ll learn how to explore your dataset and deal with common problems such as missing values and outliers. Once you have cleaned up your data, you’ll learn about the common tools data scientists use to create beautiful visualizations.
Finally, you’ll learn about the experimentation and prediction step of the data science workflow. The course focuses on a variety of statistical techniques like A/B testing, testing for statistical significance, and time series forecasting. The course ends with a section on the differences between supervised and unsupervised machine learning and when to use them.
How You’ll Learn
The course in its entirety is 2 hours long and consists of 4 parts, with each section containing video lectures and exercises.
One thing I like about DataCamp is that the course gives you many opportunities to retain what you’ve learned from the video material through interactive exercises.
| Institution | DataCamp |
| Instructors | Sara Billen, Lis Sulmont, Hadrien Lacroix |
| Level | Beginner |
| Workload | 4 hours total |
| Enrollments | 256K |
| Certificate | Free |
Fun Facts
- This is one of the few courses on DataCamp that is completely free.
- Hadrien Lacroix, one of the course instructors, has taught more than 30 courses ranging from machine learning to data engineering. He’s also currently enrolled in a Masters of Analytics at Georgia Tech.
- Sara Billen and Lis Sulmont, who co-instruct the course with Hadrien, teach more than 10 other courses and projects on DataCamp.
If you’re interested in this course, you can find more information about the course and how to enroll here.
6. A Crash Course in Data Science (Johns Hopkins University)
A Crash Course in Data Science by John Hopkins University is a short but intensive overview of data science — no coding involved. What makes it different from the previous listing is that it’s geared towards non-technical people who’ll manage and/or work with data scientists.
The goal of this course is to get you up to speed as fast as possible so that you can get to work reaping the benefits of practical data science. The course is taught from a high-level perspective, hence it will only cover the essentials without getting into the technical aspects.
There are no prerequisites required prior to taking this course.
What You’ll Learn
The course starts off by emphasizing the science in data science. Science begins with the scientific hypothesis and then tries to confirm its validity by performing experiments, with the ultimate goal of achieving useful results. Likewise, data science should start with a series of questions. What is the question you’re trying to answer with data? Do you have the data to actually answer that question? How would the answer be useful?
You’ll learn how statistics, machine learning, and software engineering play a huge role in data science. For example, what is cross validation? What’s the difference between supervised and unsupervised learning? What programming languages do data scientists use? You’ll understand these key terms and tools so that you can communicate effectively with data scientists.
Afterwards, you’ll explore the structure of a data science project. You’ll study the stages of the data science workflow and how they contribute to the overall result, like exploratory data analysis and formal modeling. Lastly, you’ll learn how data scientists communicate their insights to others, and how to determine if a data science project is successful.
How You’ll Learn
This course is 1 week long with 7 to 8 hours of material. It supplies you with various video and reading materials to learn from, along with several assignments to consolidate your learning. However, you can only access the assignments if you have paid for the certification or the whole specialization.
| Institution | Johns Hopkins University |
| Provider | Coursera |
| Instructors | Jeff Leek, Brian Caffo, Roger Peng |
| Level | Beginner |
| Workload | 8 hours total |
| Enrollments | 182K |
| Rating | 4.5 / 5.0 (8K) |
| Certificate | Paid |
Fun Facts
- A Crash Course in Data Science is the first course out of five in the Executive Data Science Specialization. The next course after this is Data Science in Real Life.
- The free textbook, Executive Data Science, is based on the contents of the specialization and provides additional examples on data science project management.
If you’re interested in this course, you can find more information about the course and how to enroll here.
7. Process Mining: Data Science in Action (Eindhoven University of Technology)
Process Mining: Data science in Action is quite different from the other courses in this ranking in terms of contents. For starters, this course won’t teach you coding. What it does teach you is the key theoretical tools and analytical skills needed to perform process mining — not “just” data mining, we are higher in the ladder of abstraction here, and we’re entering specialized territory.
This course asserts that processes should be considered first-class citizens, to the same extent as data, and therefore, that they should be put through the same scrutiny.
The course provides easy-to-use software, real-life data sets, and practical skills for you to directly apply the theory in a variety of application domains.
More on process mining: process mining is a technique used to analyze and track processes. Its goal is to help organizations turn event data into actionable insight. Example applications include: analyzing treatment processes in hospitals, understanding the browsing behavior of customers using booking sites, analyzing failures of a baggage handling system, and improving the user interface of an X-ray machine.
After taking this course, you’ll be able to run process mining projects and have a good understanding of the Business Process Intelligence field. You’ll also benefit from practical data science knowledge that can be applied directly to analyze and improve processes in a variety of domains. So this course has well defined scope within data science that may be suitable for learners that already have a background in the field and would like to explore an additional facet.
The course assumes a basic understanding of logic, sets, and statistics at the undergraduate level prior to taking this course.
What You’ll Learn
This course starts with an overview of approaches and technologies that use event data to support decision making and business process (re)design.
The first type of process mining is discovery. A discovery technique takes an event log and produces a process model without using any a-priori information. You’ll be given an example of an algorithm taking an event log to produce a process model explaining the behavior recorded in the log. The course then shows you other ways of discovering a process model from event data.
The second type of process mining is conformance. Here, an existing process model is compared with an event log of the same process. You’ll learn how to perform conformance checking to determine if reality, as recorded in the log, conforms to the model and vice versa.
Lastly, you’ll find how process mining can be applied on running processes, which is the third type of process mining called enhancement. The idea is to extend or improve an existing process model using information about the actual process recorded in some event log. The course also addresses how to get the right event data, process mining software, and how to get from data to results.
How You’ll Learn
The course spans 6 weeks, with each week taking 3 to 6 hours to complete. Every module consists of a series of short lecture videos of 8–15 minutes each, with handouts for each video lecture available to be downloaded.
Regarding assessments, there will be weekly quizzes to test your understanding of the lecture videos, and a final exam. There’s also an optional peer assignment in which you apply the tools and techniques on real data and make a short report.
| Institution | Eindhoven University of Technology |
| Provider | Coursera |
| Instructor | Wil van der Aalst |
| Level | Intermediate |
| Workload | 22 hours total |
| Enrollments | 63K |
| Rating | 4.7 / 5.0 (1K) |
| Certificate | Paid |
Fun Facts
- According to Google Scholar, Wil van der Aalst, the course instructor, is among the highest-ranked computer scientists in the world in terms of h-index: it’s 163!
- In fact, many of the technologies and tools taught in this course are pioneered by him.
- He also wrote the first book on process mining.
If you’re interested in this course, you can find more information about the course and how to enroll here.
8. Data Science Math Skills (Duke University)
Data science courses contain math — there’s no avoiding that!
The aim of this course is to teach fledgling data scientists the core mathematical concepts data science is built upon, introducing unfamiliar ideas and math symbols one at a time. By the end of this course, you’ll be ready to tackle almost any in-depth data science course out there.
To take this course, you’ll only need basic math skills. No algebra or pre-calculus needed.
What You’ll Learn
Beginning with basic set theory, you’ll learn about unions, intersections, and cardinality, and how to represent them with Venn diagrams. A real-world application of set theory is in medical testing, where false positives and false negatives exist. Then, you’ll study the properties of the real number line and how to represent inequalities with interval notation. The course then teaches you how to represent sums with the Sigma notation.
The next part of the course touches on functions and graphs. The Cartesian plane is the most common way to plot data. You’ll learn how to find the equation of a line given two points. After that, you’ll approach a function as an input-output machine, and see how to graph on the Cartesian plane, as well as its inverse.
You’ll be given a gentle introduction to calculus. You’ll learn about the concept of instantaneous rate of change and how it relates to finding a tangent line to a curve, as well as its applications in the real-world problem of optimization. You’ll learn about continuous growth, and the special constant known as Euler’s number. You’ll also explore exponents, logarithms, and the natural log function.
The course ends with probability theory — the study of uncertain but predictable outcomes — and its vocabulary and notation. You’ll study permutations and combinations which are the ways in which a set of things can be arranged, leading to the well-known Binomial and Bayes theorems. You’ll see how these theorems are able to predict the probability of a process given data that we have observed.
How You’ll Learn
The course is 4 weeks long with an estimated 13 hours worth of material. You’ll primarily learn through video lectures and supplemental readings, and of course, quizzes to test your knowledge.
| Institution | Duke University |
| Provider | Coursera |
| Instructors | Daniel Egger, Paul Bendich |
| Level | Beginner |
| Workload | 13 hours total |
| Enrollments | 302K |
| Rating | 4.5 / 5.0 (10K) |
| Certificate | Paid |
Fun Facts
- Daniel Egger, the course co-instructor, has more than seventeen years of experience creating new software products and services.
- Meanwhile, Paul Bendich directs the Data+ program which explores new data-driven approaches to interdisciplinary challenges.
If you’re interested in this course, you can find more information about the course and how to enroll here.
9. 2022 Python for Machine Learning & Data Science Masterclass (Udemy)
If you are already familiar with Python programming and want to start straight away with practical data science (especially machine learning), this course is for you. This Udemy course is the most comprehensive all-in-one package in this ranking — at least, in terms of breadth; in terms of workload, our first pick remains the king.
What I like the most about this course is that it goes through the history, theory and intuition behind each machine learning algorithm before you start applying it, unlike some courses out there. This unfortunately (or fortunately for nerds like us) means the course will expose you to math and statistics, but nothing too overwhelming. Knowing some highschool mathematics and statistics should be enough to be comfortable taking this course.
What You’ll Learn
This course covers NumPy, Pandas, Seaborn, Matplotlib, Plotly, Scikit-Learn, and supervised and unsupervised machine learning.
After setting up your Anaconda environment (a distribution of Python popular with data scientists) and a quick crash course on Python, the course begins with an introduction to NumPy and Pandas. These two libraries are arguably the backbone of Python data science as they speed up the data-centric programming process greatly. The power of modifying tables of huge datasets will be in your hands now.
Then, you’ll want to visualize whatever data you have. The course shows you two plotting libraries you’ll most often use in your data science career: Matplotlib, complex but highly configurable, and Seaborn, simple but less configurable. You’ll then learn the different kinds of plots these libraries have to offer, like the line plot, scatter plot, box plot, bar plot, and a whole bunch more. You’ll learn the strengths and weaknesses of each of these plots and when to use them.
Next, you’ll move on to the appetizing core of the course — machine learning. After cleaning and sanitizing your dataset, you’ll begin by learning the different types of machine learning models like supervised or unsupervised, and regression and classification. You’ll also discuss the limitations of machine learning — you’ll need to keep these in mind to avoid biased and unfair predictions.
You’ll start with the simplest of supervised machine learning models — linear regression. The course builds on and expands on linear regression by bringing in regularization, lasso regression, ridge regression and Elastic Net. Then, the course moves to supervised classification models, like Support Vector Machines, Decision Trees and Random Forests. A small section on Natural Language Processing is included.
We then switch gears to unsupervised machine learning models. K-Nearest Neighbors, K-Means Clustering, DBSCAN, and Principal Component Analysis will be some of the popular models that you’ll discover. Throughout your studies, you’ll learn the history and intuition behind each and every model — a full course meal!
Lastly, you’ll learn how to deploy your model to the web as an API, along with a few other considerations, like how often you should retrain and revisit your model and so on.
How You’ll Learn
The course is split up into 26 different sections, with a grand total of 44 hours of lecture material. The course will provide you with the Jupyter notebooks used in the video demonstrations, which are excellent notes to refer to.
There are many exercises that you’ll have to complete that’ll help strengthen your knowledge, and don’t worry — there are solutions walkthrough. On top of that, there are two capstone projects that you’ll complete to test your ability to work independently as a data scientist.
| Institution | Udemy |
| Instructor | Jose Portilla |
| Level | Intermediate |
| Workload | 44 hours total |
| Enrollments | 56K |
| Rating | 4.6 / 5.0 (6K) |
| Certificate | Paid |
Fun Facts
- Jose Portilla is a prolific online instructor with over 2.7 million students and 40+ courses taught on Udemy.
- The courses he teaches range from basic Python programming to web development to deep learning.
- If you’re curious as to where he got the mathematics behind the machine learning algorithms, he took them from the free book An Introduction to Statistical Learning. It’s an especially good read for beginners.
If you’re interested in this course, you can find more information about the course and how to enroll here.
10. Data Science with R (Pluralsight)
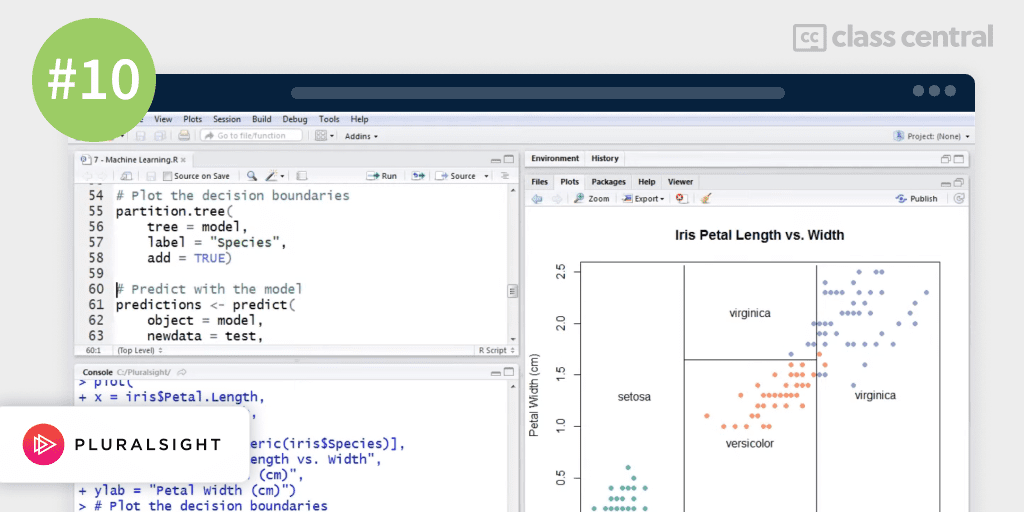
This course from Pluralsight aims to teach data science — the act of transforming data into actionable insights — using the R programming language. By the end of this course, you’ll have the skills necessary to use R to perform data analysis and deploy your own web-based interactive machine learning models.
There are no prerequisites for this course, although having some basic knowledge of programming and statistics would be helpful.
What You’ll Learn
The course covers three main topics: data science and R, data analysis, and machine learning.
The course begins with an introduction to data science with the R programming language. You’ll learn what features of R make it an awesome tool for data analytics, and how you can use R to create actionable insight from data.
Afterwards, you’ll understand how and why you should clean up your data before analyzing it. You’ll learn how to interpret descriptive statistics like mean and median, visualize data to make it easy for your audience to understand the trends and patterns involved, and build statistical models to form simple predictions with your data.
Lastly, you’ll deal with big data — datasets that are too large and complex to effectively process with traditional statistical models and methods. This type of dataset is an ideal use case for machine learning. You’ll understand how machine learning algorithms work in order to make predictions with big data. Finally, you’ll deploy your interactive machine learning application on the web.
How You’ll Learn
The course consists of 10 sections containing video lectures, demonstrations of the lecture, and summaries. All in all, the course has around 2.5 hours of learning materials.
| Institution | Pluralsight |
| Instructor | Matthew Renze |
| Level | Beginner |
| Workload | 3 hours total |
| Certificate | Paid |
Fun Facts
- The course instructor, Matthew Renze, is a data scientist consultant with over 17 years of professional experience working with tech startups to Fortune 500 companies.
- He’s also the president of Serenze Global, a non-profit organization whose mission is to improve access to technology education for under-represented individuals in the IT industry.
If you’re interested in this course, you can find more information about the course and how to enroll here.


Claudio
Excellent information Elham, thank you very much for sharing!